By Wendy Bacon, Luke Bacon and Henare Degan
In our first four reports on Air quality, we focussed on fine Particulate Matter - PM 2.5 and PM10.
Under NSW Department of Planning and Enviroment's (DPE) conditions of approval for the M4 East tunnel, WestConnex also monitors two other pollutants - Nitrogen Dioxide ( NO2) and Carbon Monoxide ( CO).
Nitrogen Dioxide spikes at Haberfield School
Last Saturday afternoon, we noticed something unusual on the Ecotech monitor. Since early Friday morning, the NO2 levels had been very high at Haberfield School. So high it fact, that national standards had been exceeded.
The major source of nitrogen dioxide is the burning of fossil fuels: coal, oil and gas. Most of the nitrogen dioxide in urban areas comes from motor vehicle exhaust or off-road equipment. Manufacturing can also contribute.
The national limit for NO2 is 0.12 parts per million (ppm) over one hour. The average yearly limit is 0.03 ppm.
Exceedances are rare in Australian cities in recent years, although this may be explained by a lack of monitoring in spots where combustion of fuel is highest. It was predicted for example, that there would be some exceedances along the WestConnex widened M4 in Sydney but because there is no monitoring, we don't know if that is the case since the widened M4 opened or not.
Short periods of exposure to high levels of NO2 can aggravate respiratory diseases, particularly asthma, leading to symptoms, such as coughing, wheezing or difficulty in breathing) and hospital admissions. Longer exposures to elevated concentrations of NO2 may contribute to the development of asthma and potentially increase susceptibility to respiratory infections. People with asthma, as well as children and older people are generally at greater risk for the health effects of NO2 ( For more information on NO2 visit US EPA ).
On Monday morning, a Haberfield School parent notified the Education Department that the NO2 levels had been well above national limits for more than two days. Shortly afterwards, the high NO2 data disappeared.
Ecotech claim to be checking the monitors at least remotely every day. So we can't help wondering how long these high levels would have continued without anyone either removing them as false results ( preferably along with an explanation) or notifying someone of the potential health dangers for the community.
Later on Monday, we submitted a list of questions to Sydney Motorway Corporation and NSW Roads and Maritime Services. We have not yet received any answers but have been told that we can expect them within two weeks.
Here are some of the questions:
Did Ecotech notify SMC about these high levels or did SMC or CPB (the contractors) notify Ecotech?
What time did this occur?
Who alerted SMC to the high NO2 results
What steps were taken to rectify the problem and by whom?
What explanation does SMC or RMS have for:
a) the very high levels of NO2?
b) the removal of the data?
We anticipate that Ecotech will explain this as a technical failure. There were gaps in the data before the spike. However,this is not the only time there have been sudden high levels of NO2. There was also a spike (although not an exceedence) in NO2 levels on one day in January at Haberfield School when all other monitors remained low.
We've also observed something else that would suggest that the levels could have been high. The high NO2 readings were paralleled by elevated PM 2.5 levels - for example, the highest 15 NO2 readings over the 48 hours ranged from 0.244 to 0.267. All but one of the PM 2.5 readings on these occasions was above 20 u/gm3. The lowest was 15 U/gm3 and there were three of PM2.5 readings of 31 u/gm3.
This could be a coincidence. The question remains - will we ever know?
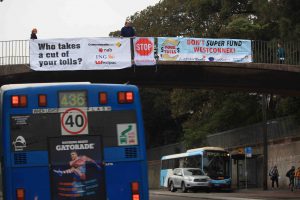
The construction of the WestConnex M4 East has exposed residents of Haberfield, Ashfield, Concord and Homebush to excessive dust and noise for years. They deserve to know the facts about these impacts. The high levels of NO2 were either the result of a technical bungle or an exceedance. Both are a problem. If technical bungles can happen over more three days, how can people trust the monitoring? If there are exceedances, people need to know so they can push for explanations and improvements - and where possible take steps to improve their situation.
Lack of transparency
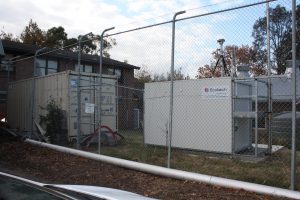
The M4 East Conditions made the 'proponent' RMS and SMC responsible for ambient air monitoring across six sites near the the M4 East tunnel route for one year before the tunnel begins operating and for two years afterwards. But SMC subcontracted this responsibility to CPB Contractors who are building the project but will not be responsible for operating the tunnel. The construction consortium is currently rushing to get the tunnel finished. They have further sub-contracted the responsibility to Ecotech in Melbourne.
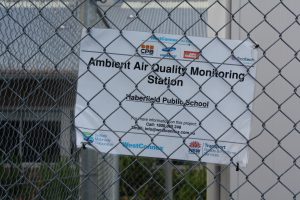
If you ring the number on the photo below to discuss concerns about the project, it may take you more than half an hour to speak to someone and even longer to speak to someone who can follow up. If you have questions about air quality, it will take days to get you answers. When you do get answers, they may not make sense or answer your original questions. This method of communication is completely unsatisfactory.
Ecotech will not answer questions from journalists or the public.If you ring, its staff explain that only SMC can answer questions. SMC and CPB have no in-house expertise in air monitoring.
As we pointed out in our last story, CPB contractors are also currently being prosecuted by the NSW EPA for breaching their license in relation to releasing toxic gases over months at the St Peters Interchange where the New M5 is being constructed.
The NSW EPA should be responsible for this monitoring. But instead of putting the monitoring in the hands of an independent body, NSW Planning cut the NSW EPA out of the process. It didn't even allocate the EPA a position on the Air Quality Consultative Committee (AQCC) that meets four times a year. This leaves RMS as the source of air quality expertise on the AQCC.
RMS air quality expert Andrew Mattes is not independent. At most WestConnex EIS sessions his role has been to promote the safety of WestConnex. He has repeatedly assured residents who expressed their concern about air quality at EIS sessions that there was no basis for their concerns about WestConnex operation or construction. The EIS modelling made no quantitative allowance for construction in assessing the impacts.
More problems with Ecotech monitors
Since Monday, the Ecotech site is missing CO readings at Haberfield School and at Allen Street Monitors. However, the line graphs are recording readings for CO but not for Allen Street.
( UPDATE: Note that there was an error here which was corrected on 27/5/2018. CO ( Carbon Monoxide) not carbon dioxide is being measured. The Allen Street monitor has now been recording no CO for more than a week.)
We are also investigating a large number of very high readings of PM 2.5 at 985 u/gm3. These get treated as errors which means that there are gaps at times when the PM 2.5 readings are trending upwards.
Negative results
Since we reported a large number of very high negative results that could have the effect of lowering results, we're glad to report that the problem seems to have been mostly fixed, or at least, far fewer negative results are appearing on the real-time monitoring site. We will probably never know what impact high negatives had on the January, February and early March results before we started collecting data in mid-March.
It is interesting to note however, that in a recent report Improving Air Quality, the Victorian Auditor-General was critical of the inclusion of negative values by the Victorian EPA:
We consider that negative values should not be included in the data used to determine hourly and daily pollutant averages. First, the lowest possible value for air pollutant concentrations is zero. Either it is present, even if in very small amounts, or it is not. Second, we find that the EPA’s inclusion of these readings introduces a negative bias that potentially under-represents actual concentrations. Further, the Air Watch historical air quality data including in EPA’s website does not have these negative values. EPA advised that it does not include negative values on its website because it would be difficult to explain to the public why some pollutant levels are recorded at below zero. When we excluded the negative values from the calculation of one-day averages, there were five more exceedance days for PM 2.5 and one more for PM 10 during 2016.