By Wendy Bacon and Henare Degan
Haberfield air quality monitors in Sydney’s Inner West have recorded higher average annual levels of fine particulate matter (PM2.5) in 2018 than any other monitors in the Sydney basin.
PM 10 and PM 2.5 are two sizes of particulates commonly measured in air pollution monitoring. PM 2.5 is the focus on this report. PM 2.5 refers to particulate matter with an equivalent aerodynamic diameter less than or equal to 2.5 micrometres. Particulate matter is measured in micrograms per cubic metre of air, which is abbreviated as µg/m3.
A monitor on Ramsay street Haberfield near Wattle Street recorded 11.6 µg/m³. Another monitor inside the grounds of Haberfield Public School recorded 11.2 µg/m³. The national limit for PM 2.5 is 8 µg/m³. The global World Health Organisation limit is 10 µg/m³.
This report compares the 2018 annual average results recorded at NSW Office of Environment and Heritage (OEH) monitors with results recorded at WestConnex monitors, owned by the Sydney Motorway Corporation (SMC) (51% owned by Transurban). The authors have searched OEH data and closely tracked and searched the Ecotech real-tiime website.
According to OEH records, only once since 1997, when monitoring of PM 2.5 began, has a NSW monitor recorded an annual average above 11 µg/m³ and that was at Liverpool in 2002. Until these 2018 results, only one other NSW monitor had recorded more than 10 µg/m³ and that was at Muswellbrook in the Hunter Valley in 2012.
Here is a spreadsheet detailing the results of OEH PM 2.5 annual averages since 2000.
Extensive scientific research has shown that there is no safe level of PM 2.5, which is linked to heart disease, cancer, premature birth and can impact lung and brain development. There is also evidence that it may be linked to diabetes, depression in adolescents and dementia.
The WestConnex monitors are operated by air quality company Ecotech which, in accordance with conditions for the WestConnex M4 East, was commissioned by the Sydney Motorway Corporation to place six real-time Australian standard monitors along the route of the M4 East tunnel for one year before the tunnel opens. Monitoring will continue for at least another two years after the M4 East tunnel opens.
Percentage above annual average national PM 2.5 national limit, January-December 2018
Ramsay Street Haberfield - 46% higher
Haberfield School - 40% higher
Powells Creek, near the junction of M4 and Parramatta Rd in Strathfield - 27.5 % higher
St Luke's Park near Gipps Street, Concord - 22.5 % higher
Concord Oval ( North side of Parramatta Rd.) - 6.25 % higher
Allens Street( North of M4 in small street and small park) - 2.5 % higher
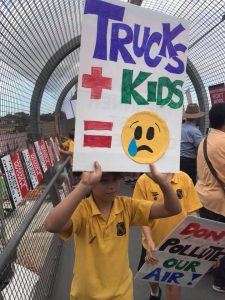
Haberfield Parents and Citizens warned NSW Planning of high PM levels
Since 2015, Haberfield school parents and other residents of Ashfield and Haberfield have been warning the government about the impact WestConnex would have on their local air quality.
The Haberfield School monitor is situated inside the school and not beside a road. It is several hundred metres from two major construction sites. So parents became even more concerned after average PM 2.5 levels for March 2018 were higher than other Westconnex monitors. As our earlier report describes, they protested after a dust storm coated the area just as school closed on April 10. Haberfield Public School P and C wrote to Premier Gladys Berejiklian, on April 13th. Asked to respond to the community protest, the Premier said:
"Nothing is more important than the health of children, nothing is more important than making sure communities feel safe at all times, and that includes during major construction. We've already laid down our plans for (stage 3) and they're pretty clear. But if there is anything else we can do to mitigate the impact on the community we're always open-minded about that.”
Most recently, in October 2018, the P and C wrote to the Department of NSW Planning:
Air quality has been a major concern for the Haberfield Public School community as a result of the WestConnex development to date. The monitoring station on the school site shows alarmingly high levels of PM2.5 (consistently sitting at least 25% higher than the annual average ambient air quality goal and unexplained by RMS, the M4 East project or the EPA) and we have been subjected to spikes of PM10 caused by dust pollution from the construction sites, most notably on April 9 this year.
Community groups raised their concerns about the pollution levels during 2018.
In June 2018, the WestConnex Action Group wrote to the Ministers for Health, Environment and WestConnex raising strong concerns about PM levels near the WestConnex construction sites at Haberfield and St Peters on the New M5. WestConnex Minister did not respond at all until August 2018 when instead of responding himself, he deputised Parliamentary Secretary Mark Coure. Coure wrote to the Westconnex Action Group:
I am further advised the readings experience at the Haberfield Public School monitoring station are much similar to other monitoring stations on the New M4 and NSW Environment Protection Authority monitoring stations across Sydney. The results to date do not indicate the Haberfield Public School monitoring station is measuring anything other than the regional pollution level with normal variations across the day.
A monthly search of OEH monitors and the July report for the Ecotech monitors reveals that this statement is false.
The average PM 2.5 levels for the first seven months of 2018 at the closest OEH monitors at Chullora, Earlwood and Parramatta North were compared with 6 Ecotech monitors.
All Ecotech monitors recorded above Chullora and Earlwood.
Three Ecotech monitors were above the highest OEH Monitor at North Parramatta:
Ramsay St Haberfield (WCX) - 12.2 µg/m³
Haberfield Public School (WCX) - 11.3 µg/m³
Powells Creek (WCX) - 10.9 µg/m³
Parramatta North (OEH) - 10.3 µg/m³
Concord Oval (WCX) - 9.8 µg/m³
Allen Street (WCX) - 8.9 µg/m³
Chullora (OEH) - 8.7 µg/m³
Earlwood (OEH) - 8.2 µg/m³
M4 EIS predictions are wrong
The AECOM M4 East EIS predicted that PM 2.5 levels would be between 8 and 9 µg/m³ in the project area. In 2021, the annual average level was predicted to be 8.7 µg/m³ at Haberfield School. In 2018, it was 11.2 µg/m³.
Nowhere around the project area was predicted to be as high as 11 µg/m³ at any stage including in 2021 and 2031.
It was predicted that areas along Parramatta Road would have improved air quality when the tunnel opens. These are areas that were already better than the areas of highest pollution in 2018.
Conclusion: The areas along the project that recorded lower levels in 2018, could get slightly improved air quality after the tunnel opens. e.g at Concord Oval if traffic shifts into the tunnel.
The areas around the ends of the tunnel in Wattle Street and Parramatta Road in Haberfield and near the end of the tunnel in Strathfield/Homebush were the most polluted in 2018. These areas are predicted to get worse in the future. Given the inaccuracy of the EIS, it is impossible to predict how much worse.
Daily exceedance predictions are also wrong
The national limit for PM 2.5 averaged over a day is 25 µg/m³.
The EIS predicted that there would be almost no daily exceedance of PM 2.5 after the project.
The EIS predicted that the highest daily level at Haberfield School would be 23.5 µg/m³. In other words, there would be no exceedances. In 2018, the highest average daily record at Haberfield School was approximately 28 µg/m³.
In all, 22 exceedances of daily average limits for PM 2.5 occurred across the project in 2018, half of which have been above 30 u/gm3. This contrasts with the EIS which predicted that the highest daily level of PM 2.5 on any day in any spot within the whole project area would be 28.5 µg/m³. Its prediction was that exceedances would be rare and would not occur at all in the vast majority of the project area.
How authorities deflected community concern in 2018
When residents raised their concerns about the exceedances at the Air quality Community Consultative Committee and the Inner West Council WestConnex Reference Group, they were told by the EPA, RMS and WestConnex that these merely reflected regional impacts of bushfires and burn-offs. There is no doubt that bushfire plays a big role in PM spikes in Sydney but the notion that this was an acceptable explanation for all the exceedances was false.
For example, there was only one PM 2.5 exceedance in 2018 at Earlwood, three at Chullora further West and five at Parramatta North, further West again. A search of the Ecotech site show one or more exceedances occurred at all Ecotech sites.
- Haberfield School - one (28.5 u/gm3)
- Concord park 3 ( 2 above 30)
- Allen Street - 3 ( two above 30)
- Powells Creek - 5 ( possibly 6) - 2 above 30
- Ramsay Street - 8 ( 3 above 30)
- St Lukes Park - 2 (2 above 30)
Bushfires and burn-off will continue to cause high pollution levels in the Sydney basin. Rather than dismissing concerns, the OEH needs to investigate how bushfires will increase levels in areas already elevated by vehicle emissions and how vehicle emissions may combine with fire emissions to build even higher levels of pollution.
Why did the M4 East WestConnex EIS fail to predict these high levels?
AECOM was responsible for the overall WestConnex EIS and air quality consultant Pacific Environment ( now owned by ERM) was contracted to do the air quality modelling. AECOM had a considerable commercial interest in the projects proceeding. Its raw data was not available to Councils, the community or independent experts. Any questions to AECOM from journalists are always referred back to SMC on the grounds of commercial confidentiality.
There are many uncertainties in EIS predictions. Traffic predictions are a notoriously uncertain field of study. Air quality predictions rely on the traffic predictions - if they are wrong the air quality predictions will be wrong. Health risk assessments just follow a quantitative formula and are dependent on the accuracy of the air quality modelling.
There was very little local monitoring undertaken for the EIS so it largely relied on OEH data from stations kilometres away and 2014 meteorological data from Canterbury Racecourse. These uncertainties were acknowledged in the EIS.
The model used had never been used in Australia before and the EPA did not have the technical expertise to evaluate it in 2015.
In its final comment on the M4 EIS, the NSW EPA remained concerned about aspects of the assessment and complained about the lack of time for comment.
Many criticisms were made of the EIS Air quality assessment, including by Marrickville Council’s independent consultant Air Noise Environment who recommended that the construction impacts should be quantified. AECOM's only response was that the Department of Planning had not required it and the impacts would be mitigated.
This weakness in the EIS and the lack of analysis of high levels in 2018 has left a serious question hanging over what the future holds for areas around WestConnex and the nature of the levels that are even closer to constructions sites and roads. The EIS does acknowledge that construction impacts could have significant impacts but assumes they will be mitigated with the use of techniques, such as watering. Years of potential impacts are disappeared from calculations of likely air quality in this way.
Assuming the M4/M5 Stage 3a goes ahead, there will be four more years of construction impacts on top of more traffic around the tunnel portals and unfiltered ventilation stack. These have not been accounted for in the M4/M5 EIS. These impacts will include the continued use of 24 hour on and off-road diesel impacts.
Independent experts are urgently needed to assess the air quality near all WestConnex sites. The EIS must be reviewed. Currently, its wrong assumptions are still being used to assess development controls around the unfiltered ventilation stacks. If the modelling is wrong, the health of more people will be at risk.
Climate change ignored in Air quality analysis.
- Climate change may be a factor in higher levels but bushfires or the impact of changing climate was never considered in the EIS. Instead, 2014 Bureau of Meteorology data was used as a benchmark.
Stacks should be filtered.
The EIS predicts that the stacks will have little impact on residents living around the stacks. But given that 2018 pollution levels are well outside anything considered in the EIS, this cannot be regarded as reliable. The Chief Scientists committee that cleared the tunnel and ventilation stack predictions is funded and administered by NSW RMS. Although it had criticisms, it cleared the weak M4 East EIS.
Haberfield School and St Peters School on the New M5 will be within the 500 metres zone of two stacks unfiltered stacks in 2023 if the M4/M5 goes ahead.
The NSW Parliamentary Committee into impacts of WestConnex have recommended that the stacks be filtered. Independent medical experts have rejected the NSW RMS view that unfiltered stacks are 'best practice.' Rather than risking even worse air quality, the governments at all levels have a responsibility to minimise air pollution.
The stacks should be filtered but arguments for this should not distract attention from damaging surface road pollution and the impacts of long term construction.
At a time of growing evidence about the negative impact of particulate matter on health, it is simply unacceptable to target schools anywhere for increased levels of pollution.
Read [our report] on PM 10 levels in Sydney in 2018.
Note: Wendy Bacon and Luke Bacon will soon be publishing a longer report on air pollution at St Peters Public school. For three years, there has been a monitor at SPPS but no reports have been published since September 2018. At that time, the PM 2.5 levels were averaging more than 11 u/gm3. For more on SPPS read this story.
Wendy Bacon is a journalist and researcher. She was previously the Professor of Journalism at UTS where she taught environmental and investigative reporting. She has been part of the community campaign against WestConnex. Henare Degan is an open data specialist and a software developer.